European Journal of Operational Research, Volume 229, Issue 2, 1 September 2013, Pages 411-421.
Salah Haridy, Zhang Wu, Ka Man Lee, Nadia Bhuiyan
School of Mechanical and Aerospace Engineering, Nanyang Technological University, Singapore 639798, Singapore.
Department of Mechanical and Industrial Engineering, Concordia University, Montreal, Quebec, Canada H3G 1M8.
Department of Industrial and Systems Engineering, The Hong Kong Polytechnic University, Hong Kong.
Abstract
The Sequential Probability Ratio Test (SPRT) control chart is a powerful tool for monitoring manufacturing processes. It is highly suitable for the applications where testing is destructive or very expensive, such as the automobile airbags test. This article studies the effect of the Average Sample Number (ASN) (i.e., the average sample size) on the chart’s performance. A design algorithm is proposed to develop the optimal SPRT chart for monitoring the fraction nonconforming p of Bernoulli processes. By optimizing the ASN and other charting parameters, the average detection speed of the SPRT chart is almost doubled. It is also found that the optimal SPRT chart significantly outperforms the optimal np and binomial CUSUM charts, in terms of Average Number of Defectives (AND), under different combinations of the design specifications. It is observed that the SPRT chart using a relatively smaller ASN and a shorter sampling interval (h) has a higher overall detection effectiveness.
Additional Information:
The control chart has become a necessity rather than a fashion to reduce variability, improve productivity and ensure quality in both manufacturing and service industries. Despite the increasing complexity of the processes in modern industries, no tool can capture the voice of a process better than the control chart.
The SPRT control chart is one of the most powerful monitoring techniques to effectively monitor manufacturing and service processes. It is widely adopted for the applications where testing is destructive or very expensive, such as deployment-rate testing of automobile airbags and durability testing for batch-produced plastic eyeglass lenses.
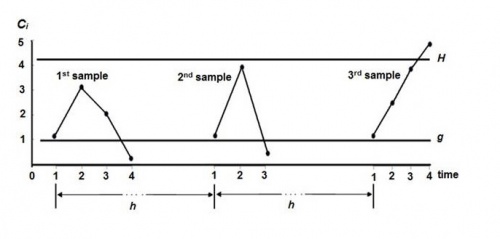
An SPRT chart has five charting parameters: Average Sample Number (ASN), reference value ({Gamma}), sampling interval (h), lower limit (g) and upper limit (H). Within a sample point, the ith observation xi is used to update the monitoring statistic Ci:
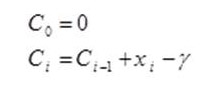
where xi is a Bernoulli random variable which is defined as xi = 1 if the ith item is nonconforming and xi = 0 otherwise. The figure below shows a sample run of the SPRT chart. As shown, one sample is inspected for every h unit time. The sequential inspection inside the first sample is terminated after inspecting the fourth unit and the process is concluded to be in control as C4 became smaller than g. Similarly, the inspection inside the second sample is terminated after inspecting the third unit and the process is deemed to be in control as C3 became smaller than g. Then, an increasing p shift occurs after the second sample. Therefore, C4 exceeded H in the third sample, and the SPRT chart signaled an out-of-control status. As a result, the whole inspection is terminated and the process should be stopped immediately for further investigation.
This article proposes an optimal SPRT chart for monitoring the fraction nonconforming p. By optimizing the charting parameters, the new optimal SPRT chart is able to increase the overall detection effectiveness by 98% compared with the basic SPRT chart. It is also found that the optimal SPRT chart is superior to the np chart and CUSUM chart by 221% and 171%, respectively, under different circumstances. While the optimal design algorithm significantly improves the overall performance of the SPRT chart, it does not increase the difficulty of its implementation.
A Sample Run of the SPRT Chart